

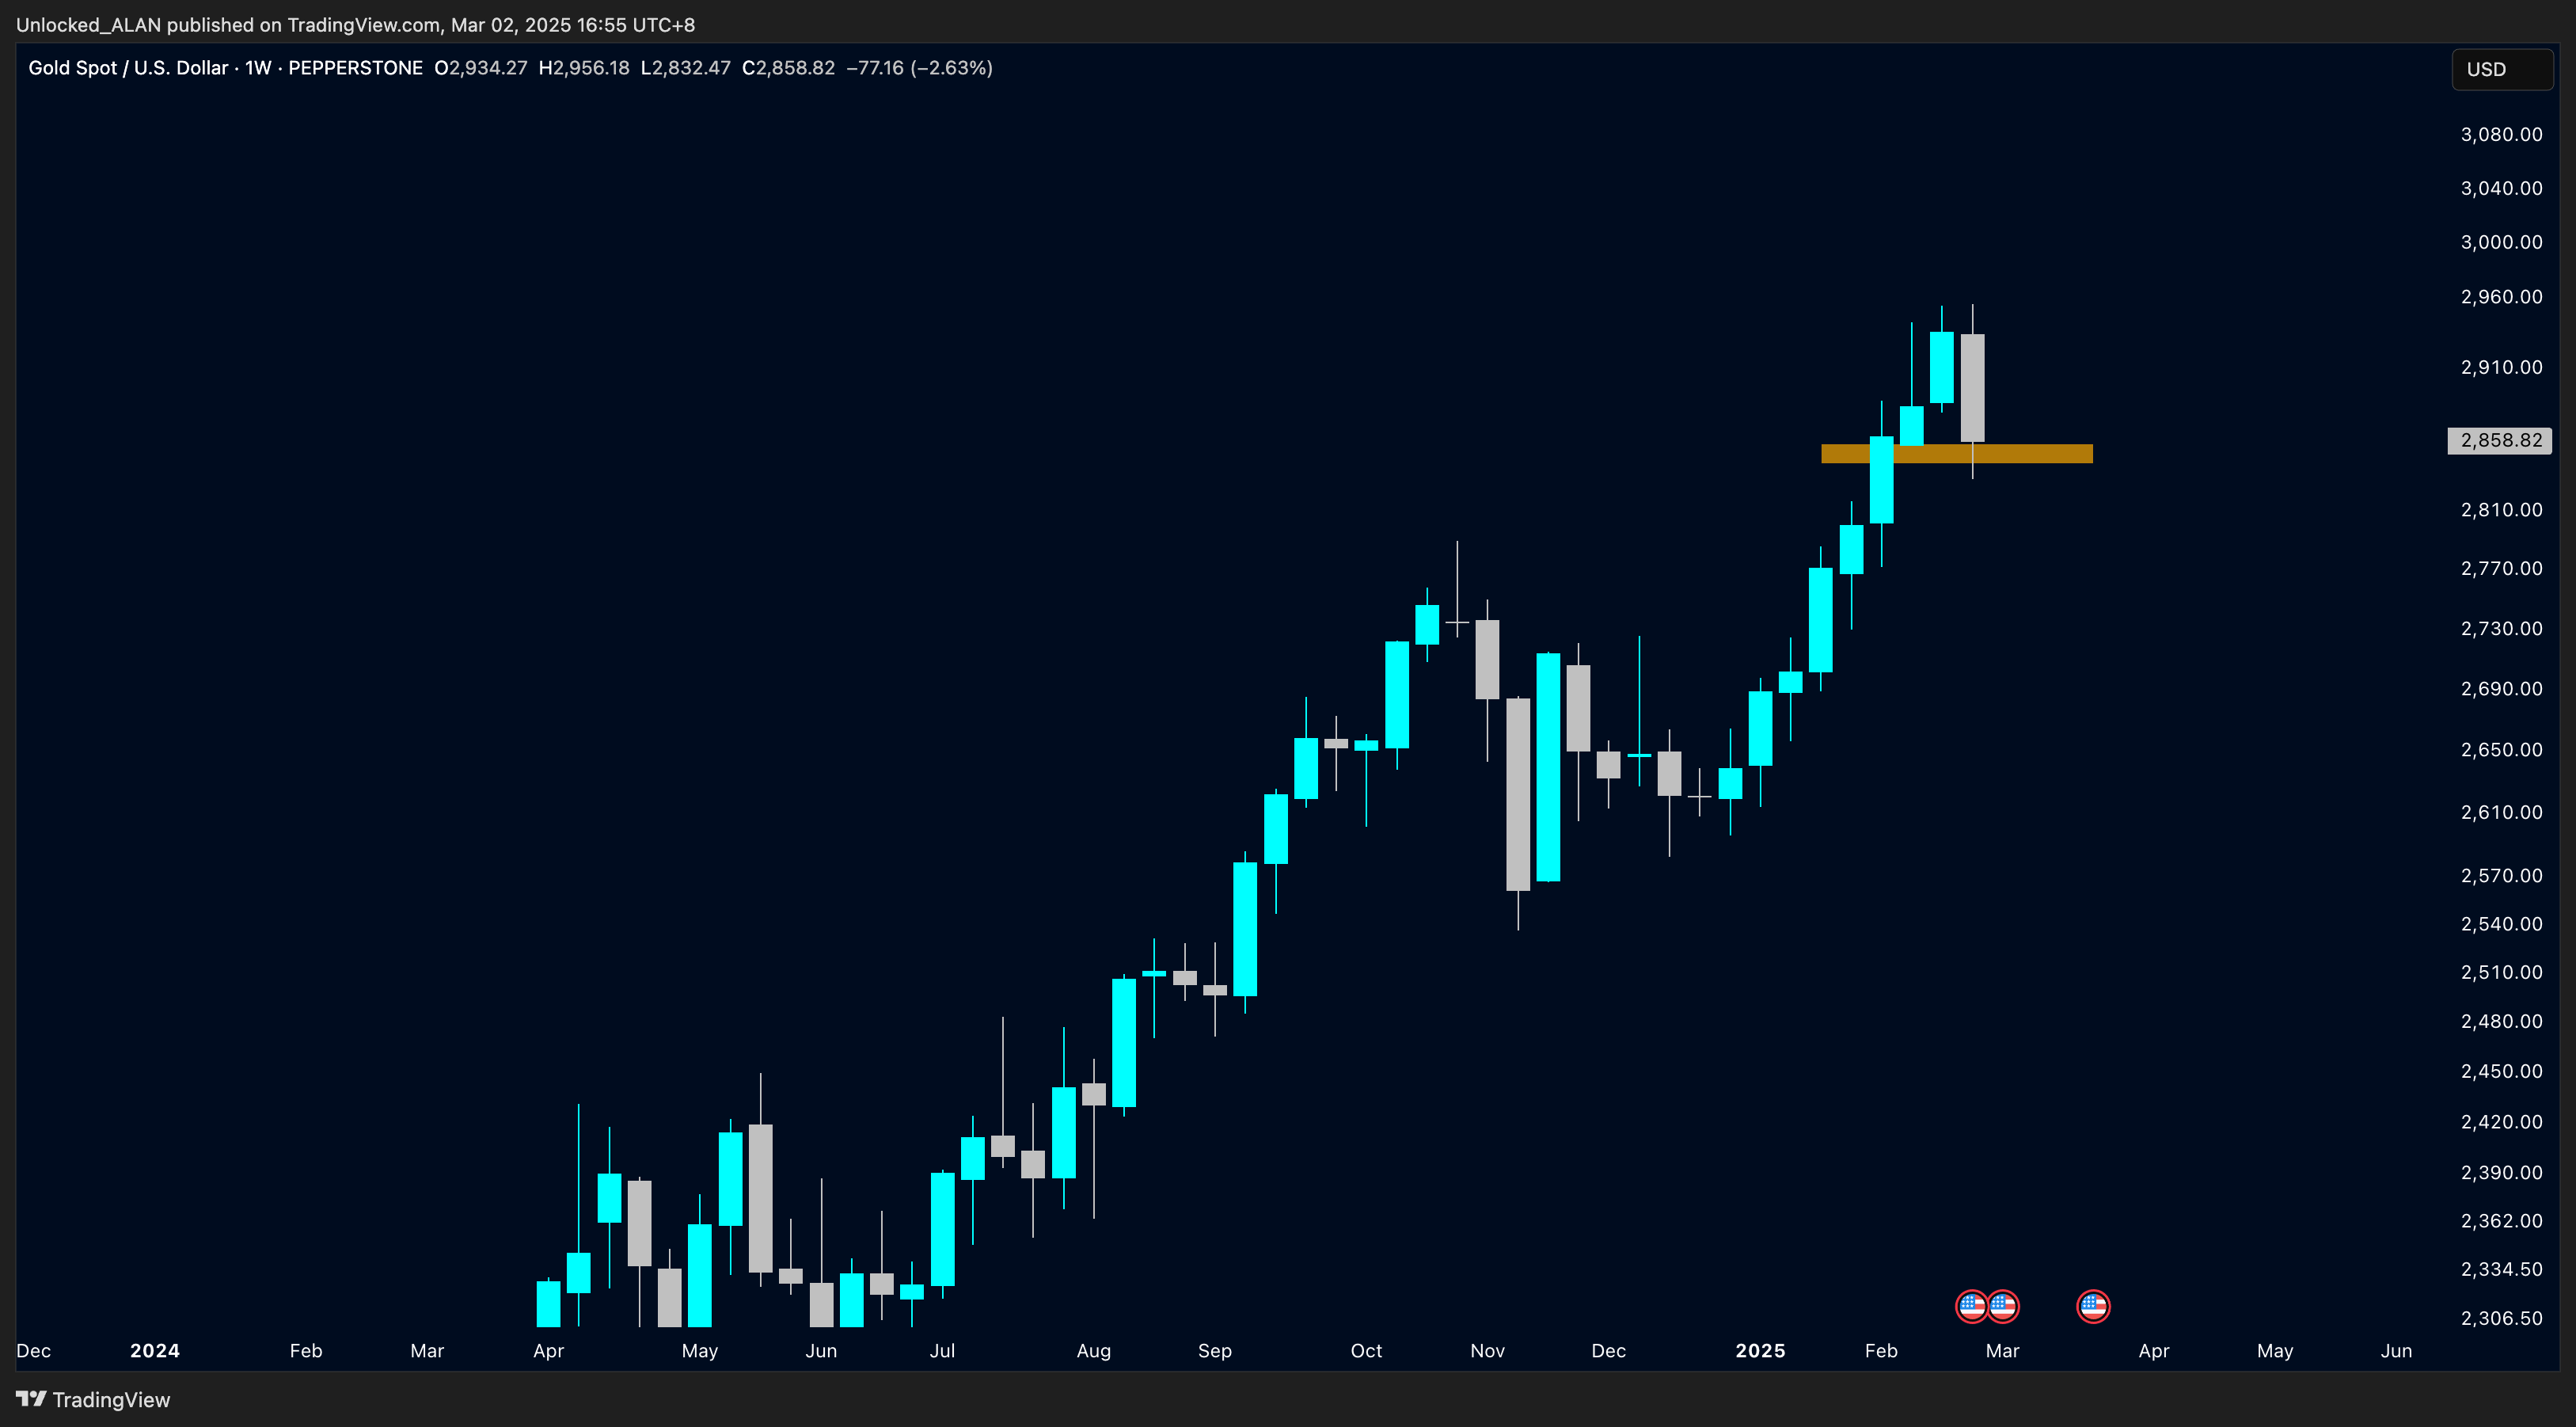
*Weekly Chart:*
• For the first time since mid-December, XAUUSD has closed the weekly candle in negative territory.
• Despite this, 2855 is acting as a support level.
• If this level breaks, we could see further downside movement.
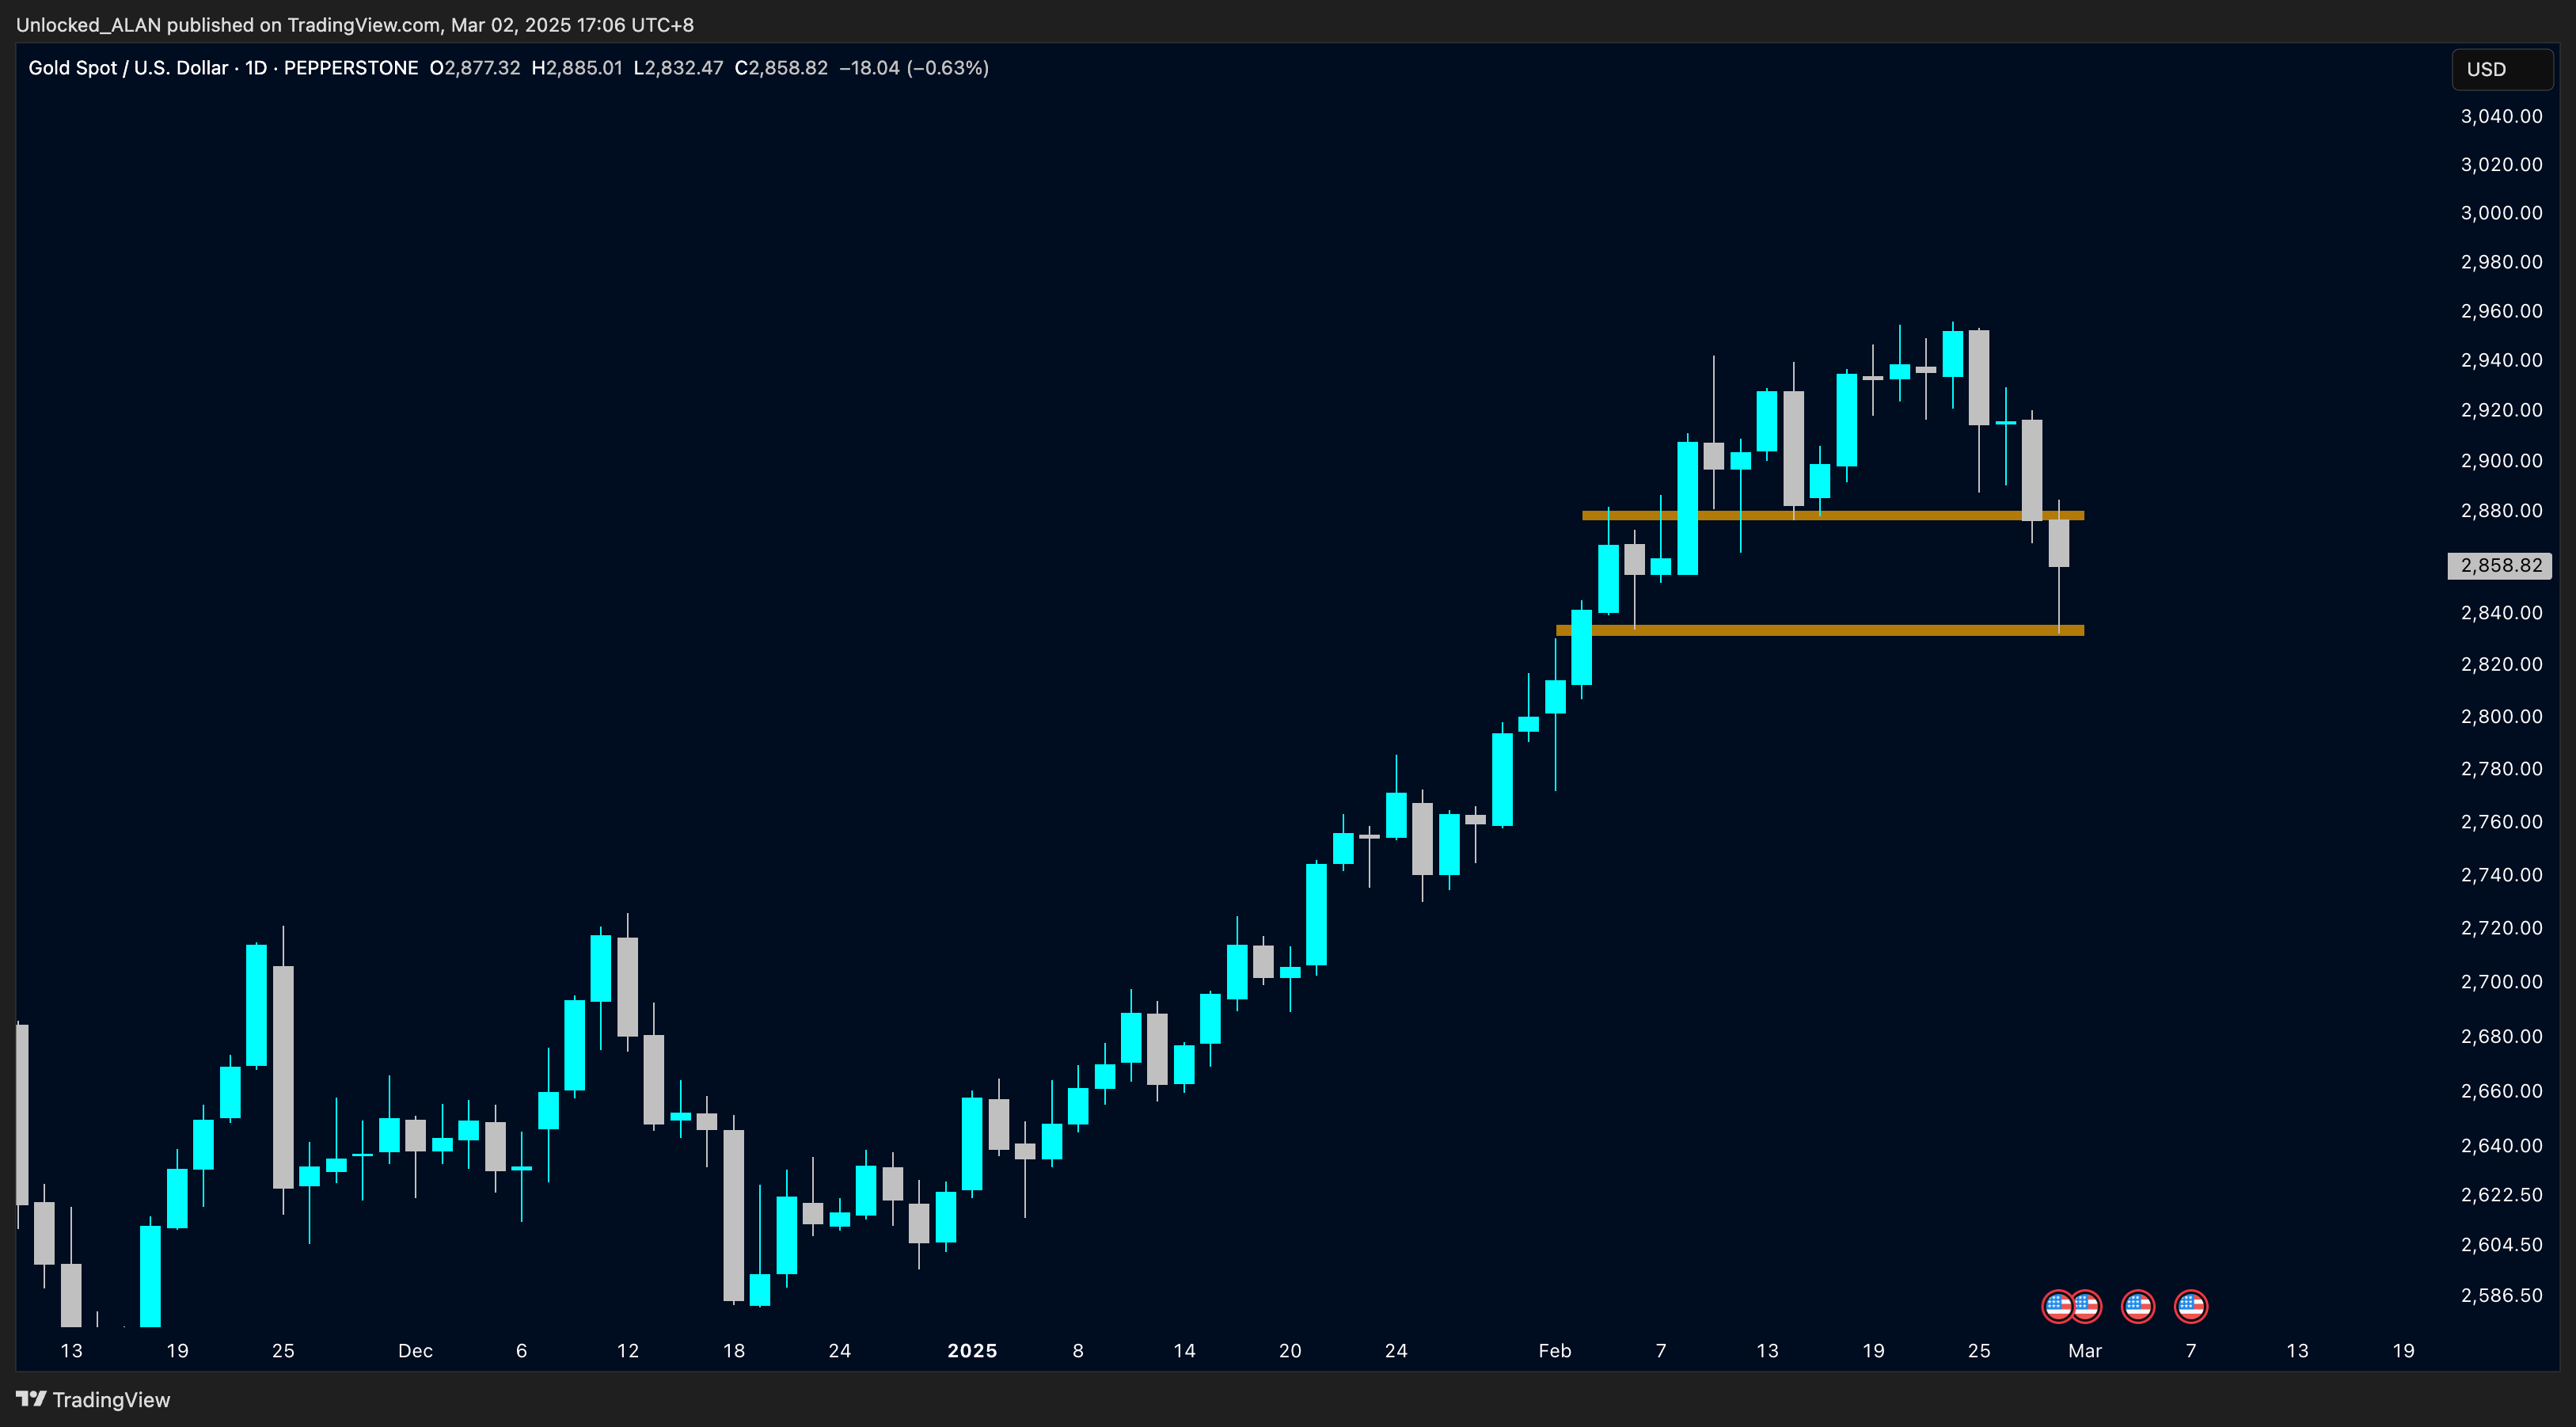
📊 *Daily Chart:*
• The 2820 level is a key support zone. A break below this could bring a test of the psychological 2800 level.
• On the upside, 2880-85 is a strong resistance level. A break above could trigger bullish momentum.
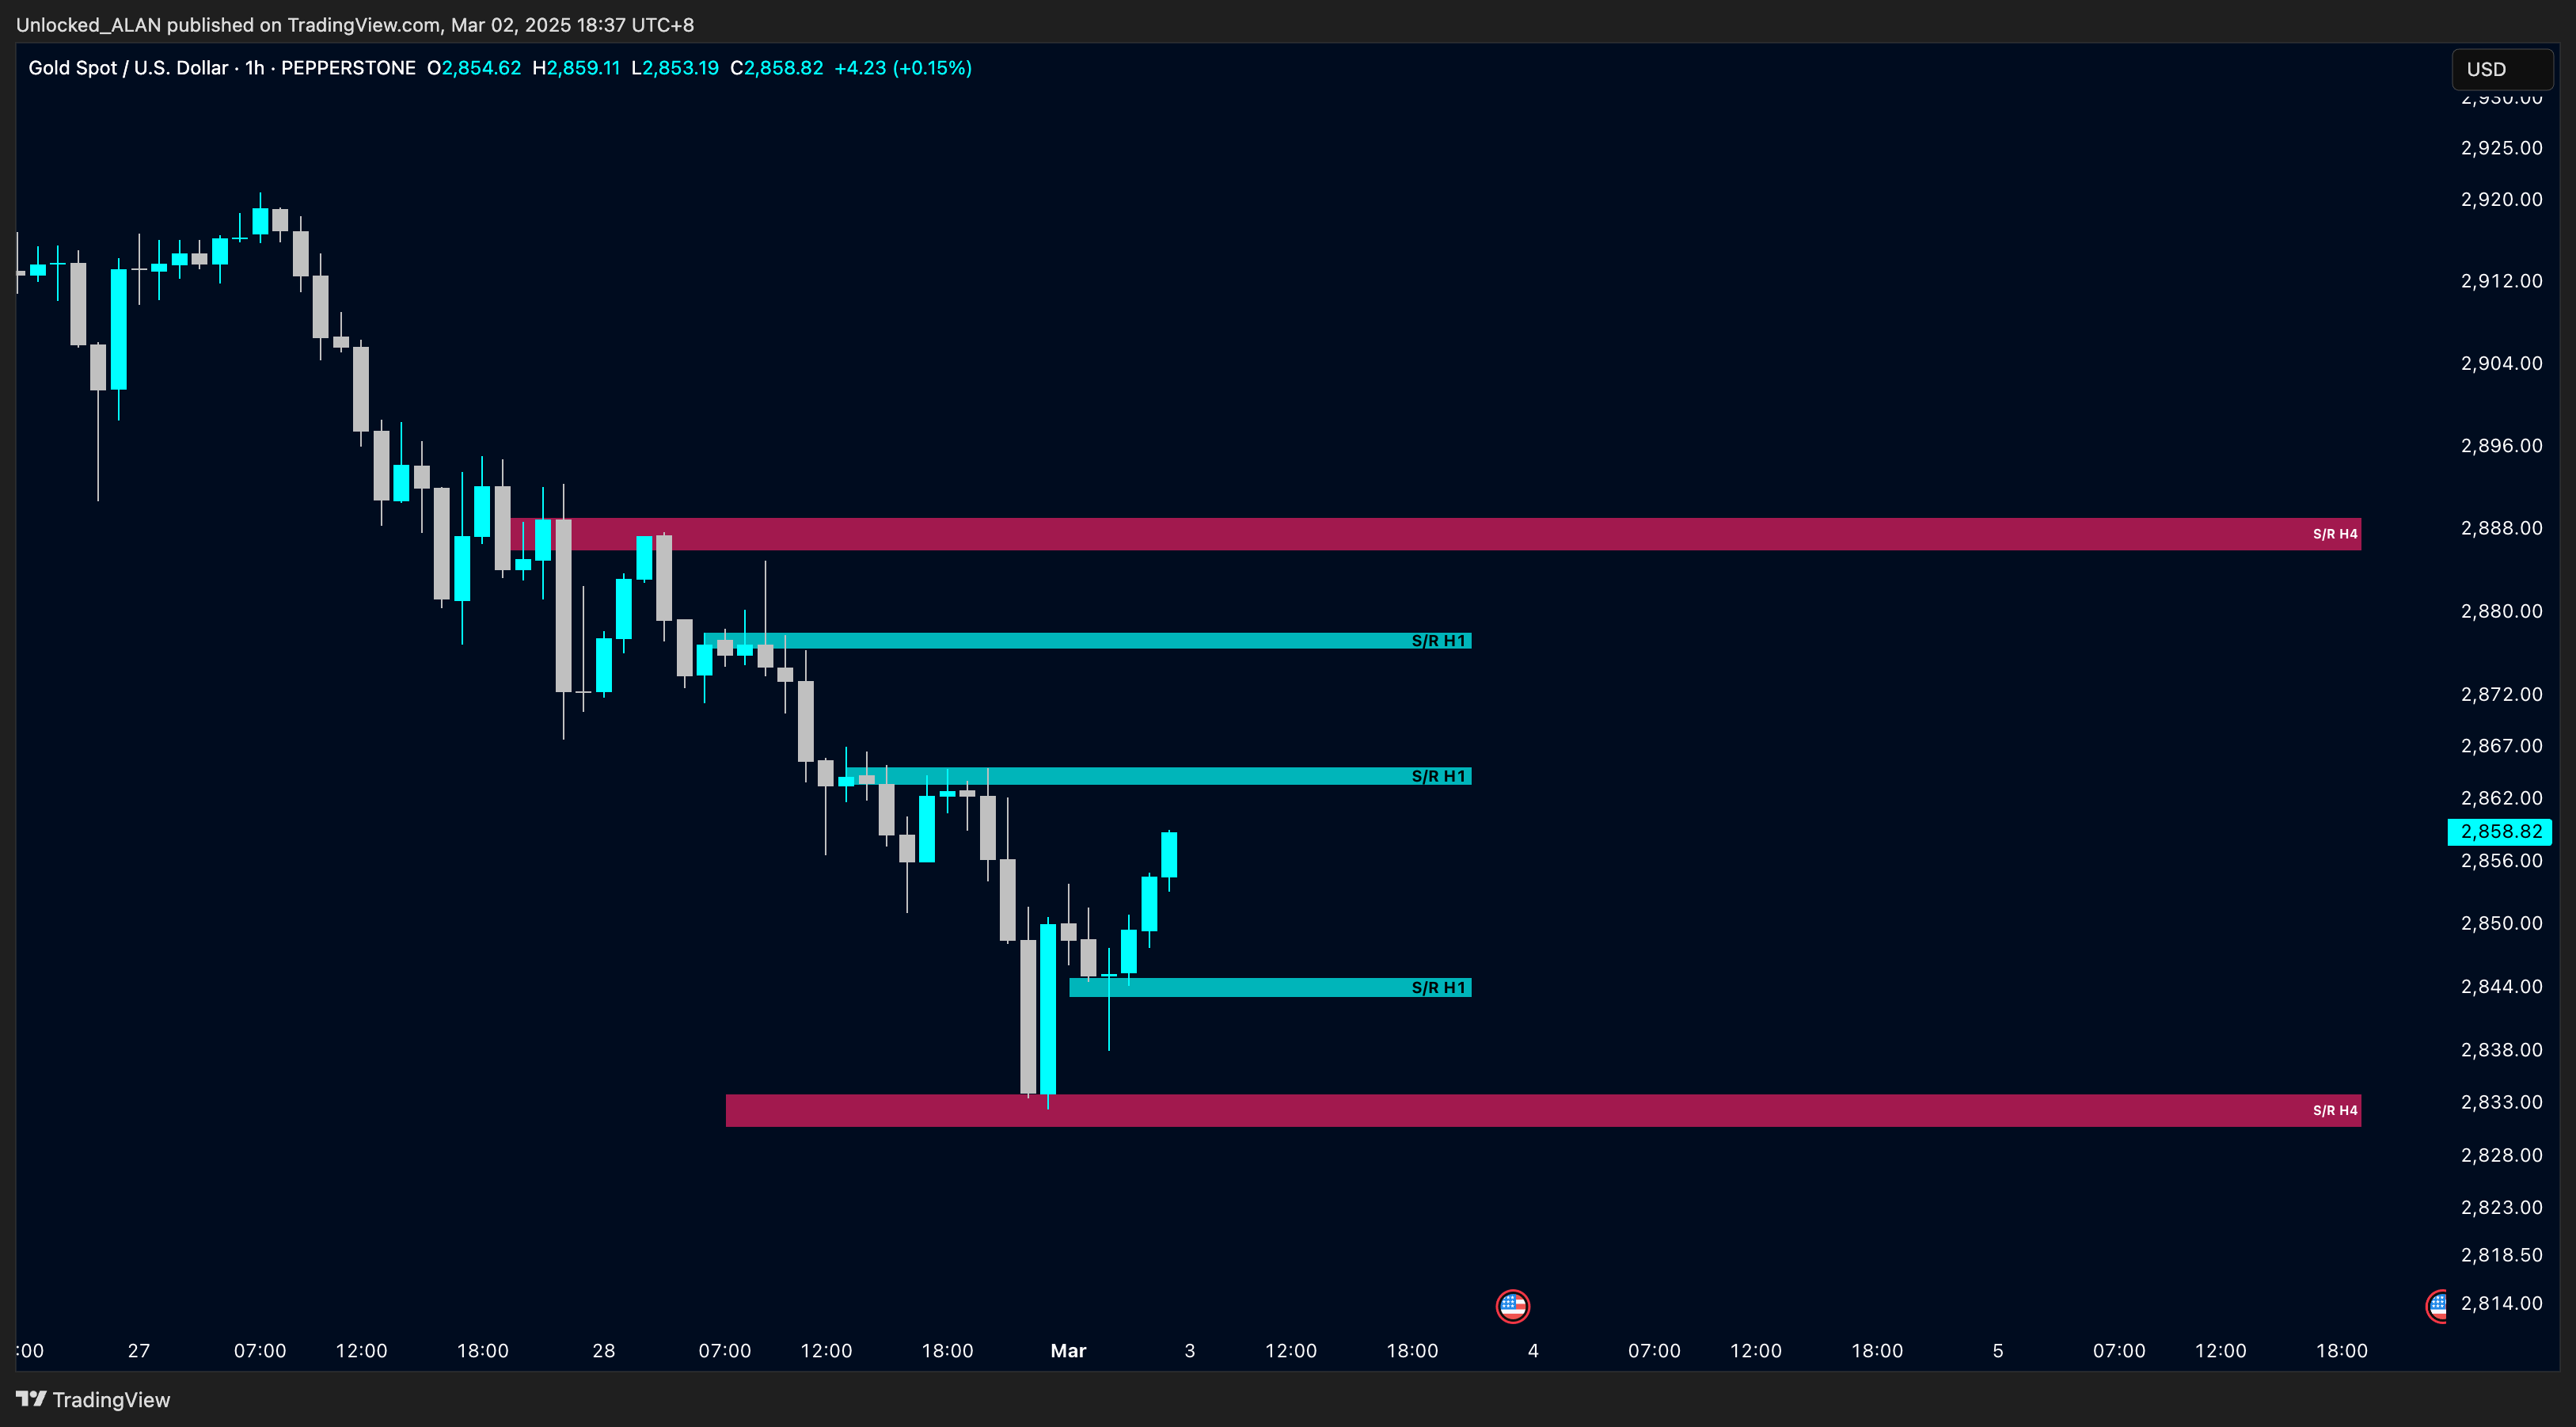
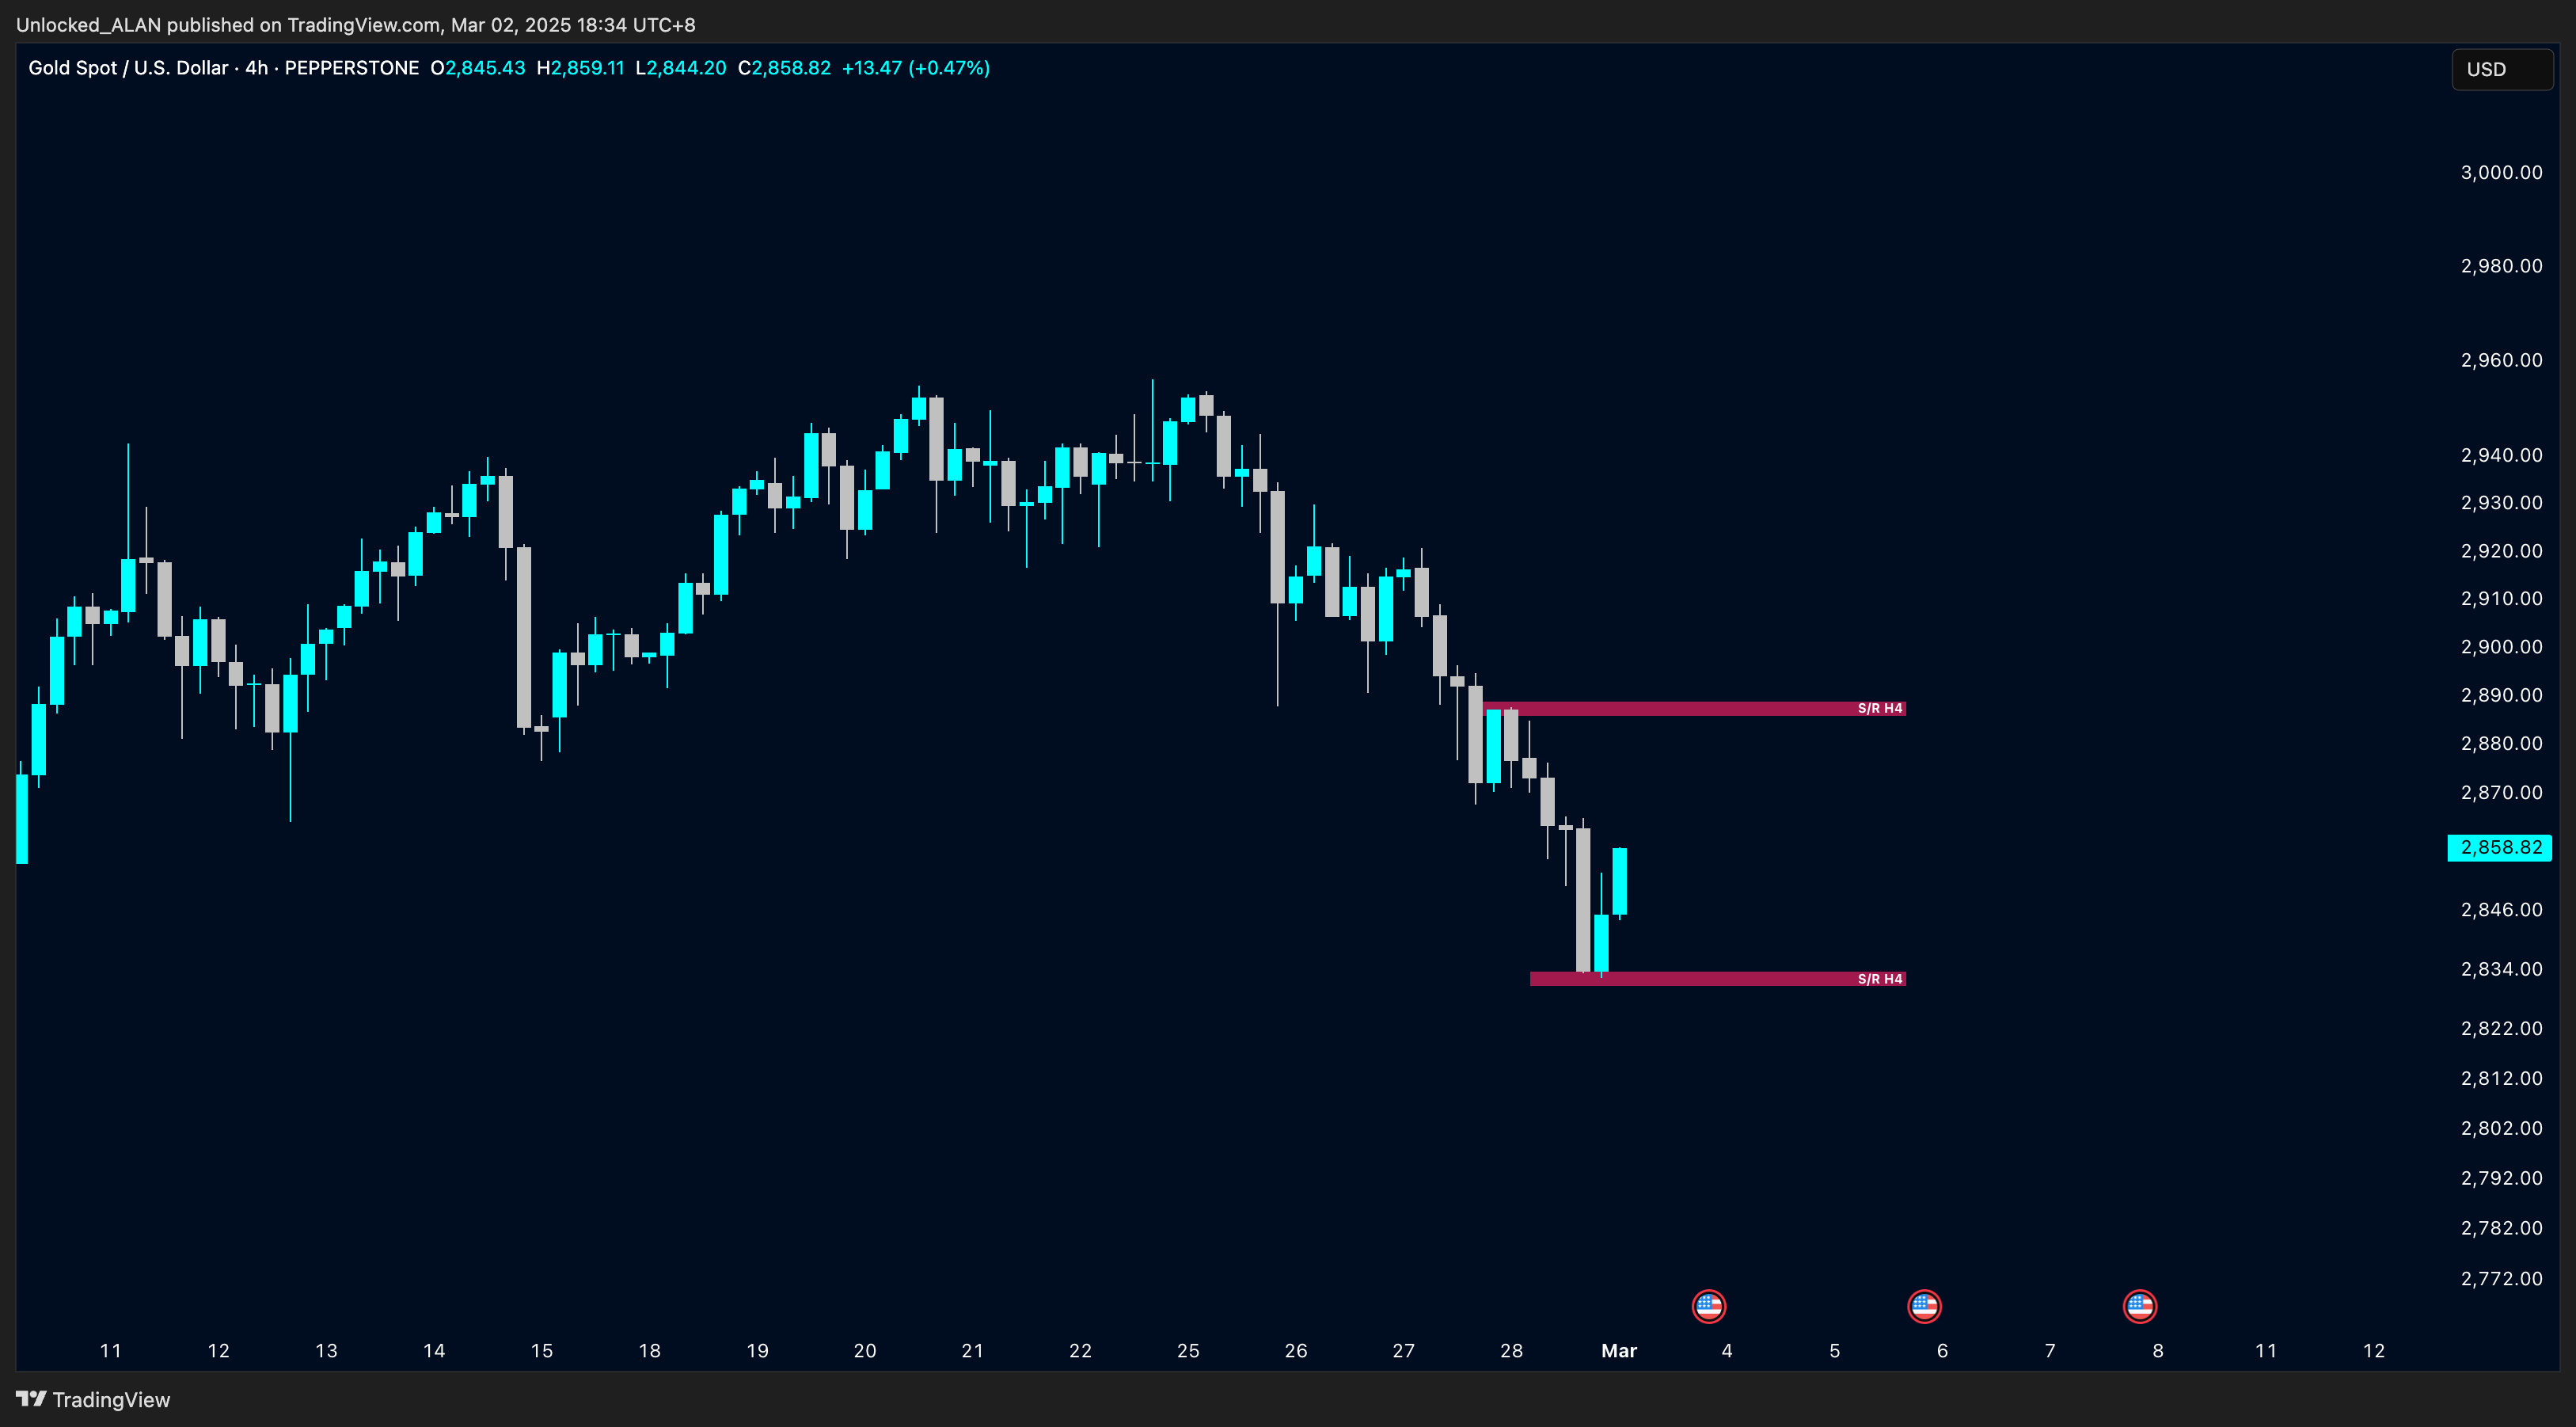
📊** 4-Hour Chart:**
• Price has formed a support at 2834, where buyers stepped in.
• Resistance stands around 2880-2885
• Below 2834, next major support is at 2820.
*Key Levels to Watch*
*Support Levels (Potential Buy Zones)*
• $2,835 – $2,840 → Strong demand zone where buyers have stepped in previously.
• $2,820 – $2,825 → Critical support; if broken, a deeper retracement may occur.
• $2,800 → Major psychological level; strong buyers expected.
*Resistance Levels (Potential Sell Zones)*
• $2,870 – $2,875 → Recent local highs; if broken, we may see continuation upwards.
• $2,885 – $2,890 → Key resistance; sellers may step in to defend.
• $2,900+ → Breakout zone; if bulls push through, expect a rally towards $2,920 – $2,930.
📊 *Watch price action carefully in Asia Session at key levels, dont be in a hurry to trade*