

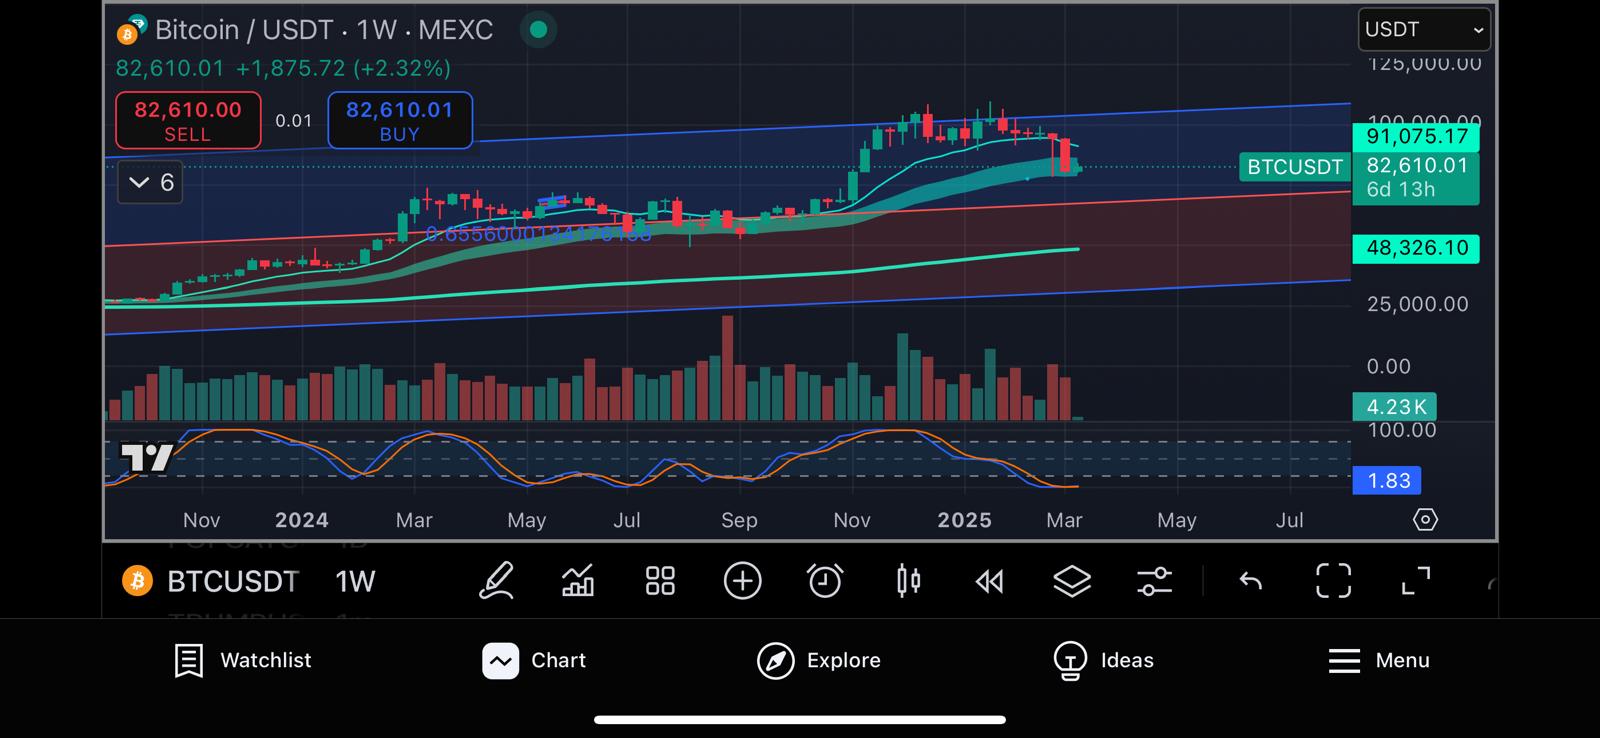
Current Price: $82,558 (+2.26%)
Exchange: MEXC
Timeframe: 1W (Weekly)
Bitcoin remains in a strong uptrend, but its momentum appears to be cooling off as major resistance levels approach. The Bitcoin Summit, hosted by Donald Trump, failed to deliver major bullish catalysts, leading to a weekend selloff. However, the long-term outlook remains bullish, provided key support zones hold.
BTC is currently trading within an ascending channel, with critical support at $78,000 – $80,000 and resistance at $85,000 – $87,000. The next breakout or breakdown will likely be influenced by a combination of ETF flows, institutional demand, macroeconomic events, and the political stance on crypto regulation.
1. Impact of Trump’s Bitcoin Summit on Market Sentiment
A. Trump’s Pro-Crypto Stance, But No Immediate Catalysts
•The Bitcoin Summit, featuring Donald Trump, was expected to be a major bullish event for BTC, but no concrete policy announcements were made.
•Trump reaffirmed his pro-crypto stance, suggesting less regulatory pressure on Bitcoin if he wins the 2024 U.S. Presidential election.
•While this is long-term bullish, markets were hoping for immediate catalysts, such as endorsements for Bitcoin ETFs or deregulation plans—which didn’t happen.
•This led to weekend sell-offs, as traders who anticipated a short-term pump liquidated their positions.
B. Regulatory & Institutional Uncertainty
•Trump’s statements hinted at a friendlier regulatory environment for Bitcoin, but uncertainty remains around SEC policies and ETF expansions.
•Institutional investors were looking for clearer signals on how crypto will be regulated in the U.S., but the lack of specifics means short-term volatility will persist.
•The real impact of the summit may be seen closer to the U.S. elections, as investors start factoring in political risks.
⸻
2. Bitcoin Technical Outlook Based on Your Chart
Key Support & Resistance Levels
Support Levels (Downside Targets)
1.$78,000 – $80,000 → Immediate weekly support; BTC must hold this zone for a continuation to new highs.
2.$72,000 – $75,000 → Critical structural support and mid-channel zone.
3.$65,000 – $66,000 → A deeper retracement target and key liquidity area.
4.$48,000 – $50,000 → Extreme downside scenario if Bitcoin enters a major correction phase.
Resistance Levels (Upside Targets)
1.$85,000 – $87,000 → Immediate resistance, potential breakout zone.
2.$90,000 – $91,000 → Major psychological resistance and upper channel boundary.
3.$100,000+ → Ultimate target if BTC clears all resistances and enters price discovery.
⸻
3. Technical Indicators & Market Structure
A. Price Action: Inside an Uptrend Channel
•BTC remains inside a strong ascending channel, respecting both the mid-line and upper boundary.
•Price is testing dynamic support, meaning buyers need to defend the $78,000-$80,000 zone for the uptrend to continue.
•A weekly close above $85,000 will likely lead to $90,000+, while a break below $78,000 could trigger further downside.
B. Volume Analysis: Mixed Signals
•Volume has been decreasing, suggesting weaker bullish momentum in recent weeks.
•A breakout with strong volume is necessary to confirm continuation toward new highs.
•If volume remains low, BTC might consolidate or correct downward before the next push.
C. Stochastic RSI: Cooling Off
•The Stochastic RSI is rolling over from overbought conditions, indicating that momentum is slowing down.
•If the Stoch RSI crosses downward, BTC may experience a pullback to mid-range levels before resuming its uptrend.
⸻
4. Bitcoin Weekly Breakout Scenarios
A. Bullish Scenario: Breakout Above $85,000
Trigger: BTC reclaims $85,000+ with strong volume.
Entry: Retest of $82,500-$83,500 as new support.
Targets:
•$87,000-$90,000 (major resistance).
•$100,000+ (psychological level & price discovery).
Invalidation: Weekly close below $78,000 would signal a fake breakout.
B. Bearish Scenario: Breakdown Below $78,000
Trigger: BTC closes below $78,000 with increased selling pressure.
Entry: Retest of $78,500-$79,000 as resistance.
Targets:
•$75,000 (first support level).
•$72,000-$70,000 (high-liquidity area).
•$65,000-$66,000 (major support before deeper corrections).
Invalidation: BTC reclaims $80,000+ quickly, signaling a failed breakdown.
⸻
5. Fundamental Factors to Watch
A. ETF Inflows & Institutional Demand
•Bitcoin ETFs continue to attract institutional money, but we need to watch if inflows remain strong or start slowing.
•If ETFs continue to see record inflows, BTC could push past $90,000-$100,000.
B. Federal Reserve’s Impact on Bitcoin
•If the Federal Reserve signals rate cuts sooner than expected, BTC could see a bullish breakout.
•However, if inflation remains high and the Fed delays cuts, risk assets like BTC could see short-term weakness.
C. Bitcoin Halving Narrative & Miner Behavior
•The Bitcoin halving event is approaching, historically leading to strong rallies.
•If miners start selling aggressively, BTC could temporarily correct before continuing its uptrend.
⸻
6. Market Sentiment & Final Thoughts
What’s Next for Bitcoin This Week?
1.BTC must hold above $78,000 to maintain the uptrend.
2.Breakout above $85,000-$87,000 = path to $90,000+.
3.Failure to hold $78,000 could trigger a pullback to $75,000-$72,000.
4.ETF flows, Fed policy, and Bitcoin halving hype remain key drivers.
5.Trump’s Bitcoin Summit lacked immediate catalysts, but long-term effects may be bullish if he pushes for pro-crypto policies.
Conclusion: Bitcoin is in a Critical Zone
•BTC remains bullish as long as it holds above $78,000.
•A weekly close above $85,000 = bullish continuation to $90,000-$100,000+.
•A breakdown below $78,000 = possible retracement to $72,000-$65,000.
Traders should watch for volume confirmation and prepare for high volatility as BTC approaches key decision levels.
⸻
📌 Summary of Key Levels
✅ Resistance: $85,000 – $87,000, $90,000 – $91,000, $100,000+
✅ Support: $78,000 – $80,000, $75,000 – $72,000, $65,000 – $66,000
✅ Breakout Confirmation: Weekly close above $85,000
✅ Bearish Reversal: Weekly close below $78,000